The Real Costs Behind Every Tour Ticket Price: Cost Plus Pricing
This is part 3 of our Pricing Series. You can watch the whole series here, or start with part 1 here.
Most tour operators discover they’re losing money on every single tour only after their bank account tells them so. The math behind tour pricing isn’t just about covering your costs – it’s about understanding which costs actually matter.
Something we see way too often from tour operators: Great reviews, happy customers, packed tours. Yet they were hemorrhaging money. The culprit? They’d never calculated their true cost per tour.
The Cost-Plus Pricing Framework
The good news is that cost-plus pricing is one of the most simple and intuitive approaches, especially when developing new tours, products, or services. It works in three straightforward steps:
First, calculate all costs associated with your tour. Second, add a markup percentage or desired profit margin. Third, arrive at your selling price.
The power of this approach lies in its comprehensiveness. It forces you to account for all expenses before setting prices. Many tour operators undercharge simply because they haven’t accounted for all their costs.
Our Tour Pricing Calculator can help! Download yours today!
Understanding Fixed vs. Variable Costs
The first distinction at the tour level is understanding fixed costs versus variable costs.
Fixed costs don’t change regardless of how many guests are on your tour. Whether you have one passenger or twenty, these costs remain the same for each experience. Examples include:
- Guide fee or salary for the tour
- Vehicle rental
- Fixed permit fees
- Equipment usage
- Fuel for a predetermined route
Variable costs change directly with the number of guests. More guests means higher variable costs. Examples include:
- Admission tickets
- Food tastings per person
- Activity fees
- Individual souvenirs
- Additional guides needed for larger groups
Understanding this distinction is important because it impacts your profitability at different occupancy levels. It determines how many people need to be on your experience to break even and set trip minimums.
The Critical Overhead Calculation
Here’s where many operators miss the mark: all those tour-level costs are separate from your overall business expenses. These overhead costs exist whether you run one tour or one hundred:
- Office rent
- Insurance
- Website maintenance
- Marketing and advertising
- Accounting and legal fees
- Software subscriptions
- Your salary as the business owner
- Taxes and licenses
These overhead costs are essentially fixed costs for the business. Even something like a $5,000 marketing campaign – you’ll pay for that advertising whether or not you actually run any tours.
Many tour operators make the mistake of only considering on-tour costs when pricing, forgetting these overhead expenses entirely.
Allocating Business Expenses to Tours
One simple way to allocate business expenses to individual tours involves estimating:
- Your total annual business operating expenses
- How many tours you expect to run per year
- The average number of guests per tour
This calculation gives you a business overhead cost per guest that must be built into your pricing. There are several ways to handle these overhead expenses, which become clearer when you see them in action.
Essential Pricing Terminology
Before diving deeper, let’s define the key terms you’ll encounter:
Gross Revenue: The total amount of money you receive from tour sales before any expenses are deducted – all revenue before taking anything out.
Cost of Goods Sold (COGS): All direct costs associated with delivering your tour – guide fees, admission tickets, food, transportation. These costs would disappear if you didn’t run that specific tour.
Gross Profit: What remains after subtracting COGS from gross revenue. This is the money available to cover business operating expenses and ultimately generate profit. Gross Profit = Total Sales – COGS.
Gross Margin: Your gross profit expressed as a percentage of gross revenue. For tour operators, healthy gross margins typically range from 40-60%.
Net Profit: What remains after all business expenses (both COGS and operating expenses) are paid. This is your actual business profit.
Break-Even Point (Tour Level): The number of guests or revenue per departure needed to cover all costs for that specific tour. Below this point, the tour runs at a loss. Above it, you have extra revenue for the business.
Trip Minimum: The minimum number of guests required to justify running a tour at meaningful profit (not just breaking even). Trip minimums are always set above the break-even point and include room for profit margin plus contribution to annual operating expenses.
Break-Even Point (Business Level): Total guests or revenue required to cover all business expenses, including rent, salaries, marketing, and COGS. Even if individual tours are profitable, the business must reach this threshold to be sustainable.
Minimum Viable Revenue: The revenue target required to cover all costs and generate healthy profit margins that support business growth and reinvestment.
Using the Day Tour Pricing Calculator
Let’s put this framework into action with our pricing calculator, designed specifically for day tour operators. The calculator uses green cells for editable inputs and red cells for automatic calculations – green means go, red means stop.
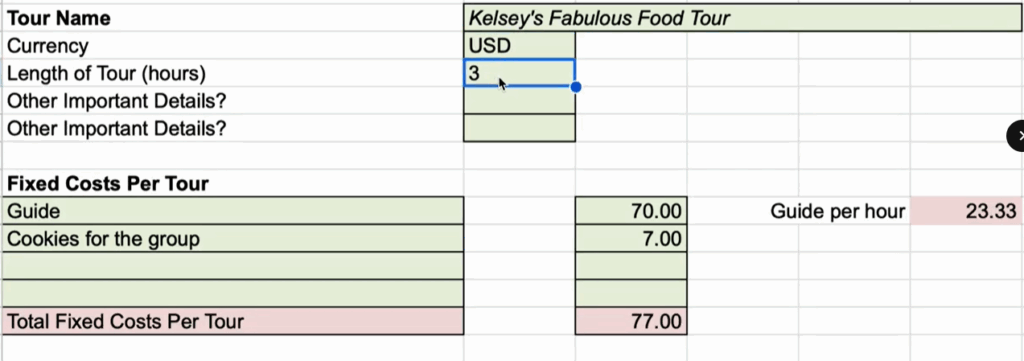
Starting with a food tour example, you’d input:
- Tour name: “Kelsey’s Fabulous Food Tour”
- Currency and tour length (3 hours)
- Fixed costs: Guide fee of $70 (about $23/hour)
- Additional fixed costs: Perhaps a $7 package of local cookies shared with the group
Notice these are fixed costs because they don’t change with guest count. Whether one person or twelve shows up, you’re buying that same package of cookies.

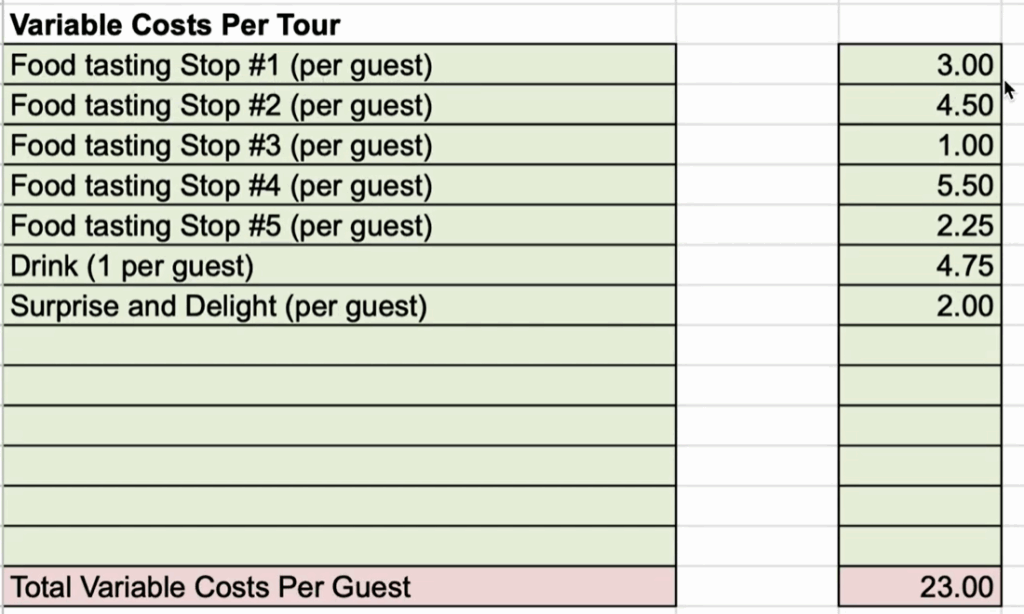
For variable costs, you’d list each tasting stop with its per-guest fee:
- Food tasting stop #1: $X per person
- Food tasting stop #2: $Y per person
- And so on…

The calculator automatically totals your variable costs per guest. This helps when designing tours – if you notice one stop costs significantly more than others, you might reconsider including it.
The Pricing Sweet Spot
The most important cell in the entire calculator is the gross ticket price – the retail price your guests pay. You manually adjust this amount to reach your desired gross profit margin.
The calculator then generates a profit margin table showing:
- Number of guests across the top
- Total revenue generated
- Cost to run the tour
- Profit or loss in dollars
- Gross profit margin percentage
Remember to account for additional costs:
- GST or VAT (if applicable)

- Credit card processing fees (typically 2.9% + $0.30)
- Booking platform fees (often 6%)
- Distribution commissions (covered in another lesson)
A Real Pricing Example
Working through an actual food tour calculation:
- Fixed costs: $77 (primarily guide fees)
- Variable costs: Multiple tasting stops totaling significant per-guest expenses
- Initial price attempt: $52.50
At this price, the tour needed three guests just to break even on direct costs. Even worse, reaching a 40% gross margin required five guests, and 60% wasn’t achievable until thirteen guests – clearly unsustainable.
Raising the price to $65 improved margins slightly, but 60% gross margin still required thirteen guests. This indicated the price needed to be much higher.
At $85 per person, achieving 60% gross margin became possible with six guests – much more realistic. But this still wasn’t the complete picture.
Factoring in Annual Operating Expenses
The third tab of the calculator addresses annual operating expenses:
- Target take-home pay
- Administrative wages
- Vehicle operating costs
- Advertising and marketing
- Rent
- Insurance
- Repairs and maintenance
- Professional services
- Communications
- Office supplies
- Banking fees
- Memberships
After inputting these expenses, you can see your total annual operating expenses and understand how they impact individual tour pricing.
Maximum vs. Average Capacity
Two critical concepts for projecting profitability:
Maximum Tour Capacity: The theoretical maximum – if every tour sold out at full capacity. While nice to know, this almost never reflects reality.
Average Capacity: Based on historical data or realistic projections. If you know you typically run 80 tours annually (not 90) with an average of 8 guests (not 12), use these figures for accurate planning.
For seasonal operators, the timing doesn’t matter – focus on the total annual numbers within your operating season.
The Final Calculation
Using our food tour example with realistic numbers:
- Maximum capacity: 90 tours, 12 guests each
- Actual average: 80 tours, 8 guests each
- Annual operating expenses: Including $40,000 owner salary
At $85 per ticket, the calculator showed an annual loss of $7,000 – an 11% negative margin. Even with seemingly healthy tour-level margins, the business was unprofitable.
Adjusting to $105 per ticket finally achieved a 9.73% net profit margin – and that’s after accounting for the owner’s salary. This is why understanding the complete picture matters.
Customizing Your Calculator
The base calculator is a starting point. Many coaching members customize it further:
- Adding multiple tours with different cost structures
- Allocating overhead based on revenue contribution
- Adjusting for premium vs. budget tour offerings
For instance, if Tour A generates 75% of revenue while Tour B generates 25%, you might allocate overhead expenses proportionally rather than equally.
Your Pricing Action Plan
Cost-plus pricing transforms guesswork into strategy. By accounting for all expenses – not just the obvious ones – you build profit margins that sustain your business long-term.
The framework particularly shines when creating new tours. You can quickly input fixed and variable costs, then see exactly what price points achieve your target margins.
Remember the key distinction: gross profit margin (per tour profitability) versus net profit margin (annual business profitability). Many operators achieve healthy gross margins but still lose money annually because they forget overhead expenses.
Using this calculator, that food tour operator who was losing money despite sold-out tours discovered they needed to charge $40 more per ticket. The result? Not only profitability but increased bookings due to perceived value.
Stop pricing based on competitor rates or gut feelings. Start using actual math to determine prices that sustain both your tours and your business. Download the calculator at guestfocus.com/pricing and see what your numbers reveal.
Want help creating more engagement (and stellar reviews) for your tours? Book a free 45-minute strategy call with us today!


